Intel® Intel® Software Development Products for Intel® Platforms and Technologies
Intel® VTune™ Performance Analyzer 9.1 For Windows*
Product Information
 Overview

 Compatibility Print Print
 Features

 System Requirements
 New In This Release  Support  

Overview
Intel® VTune™ Performance Analyzer 8.0 For Windows*

Deliver fast software on the latest 64-bit multi-core systems running Microsoft Windows Vista*, Windows* XP or Windows Server*. Locate performance bottlenecks without recompilation and with very low overhead (under 5%). Analyze the results using a graphical interface with strong Visual Studio* and .NET integration. Quickly drill down to the source to identify problematic lines of code.

Optimize Multi-Core Performance
Intel® Thread Profiler included! Not getting the performance you expected after threading your application? Intel® Thread Profiler helps you tune multi-threaded code, for optimized performance on today's multi-core processors.

Highlights
Improve application performance on Intel architectures with these optimization features:

Microsoft Windows Vista* compatible
 
Microsoft Visual Studio* 2005
integration


Intel® Thread Profiler tune
for quad-core
Click any image to enlarge

32 and 64-bit support for Microsoft Windows Vista*, Windows* XP, and Windows Server*. (details)
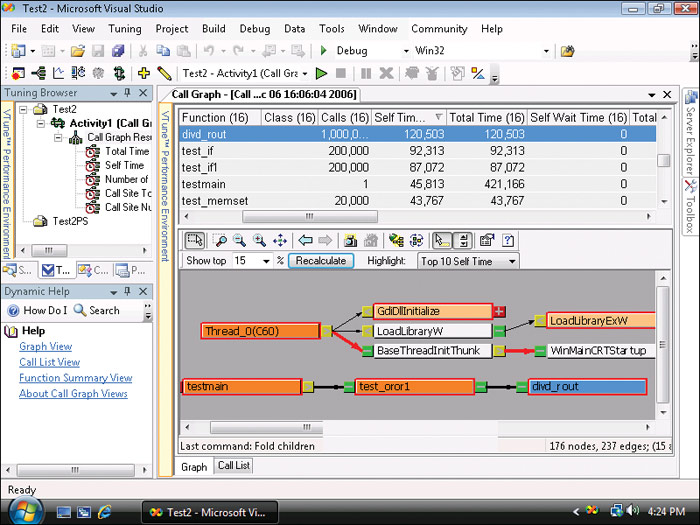
Integrated with Microsoft Visual Studio* 2005.
Supports the latest Intel® quad-core processors. (details)
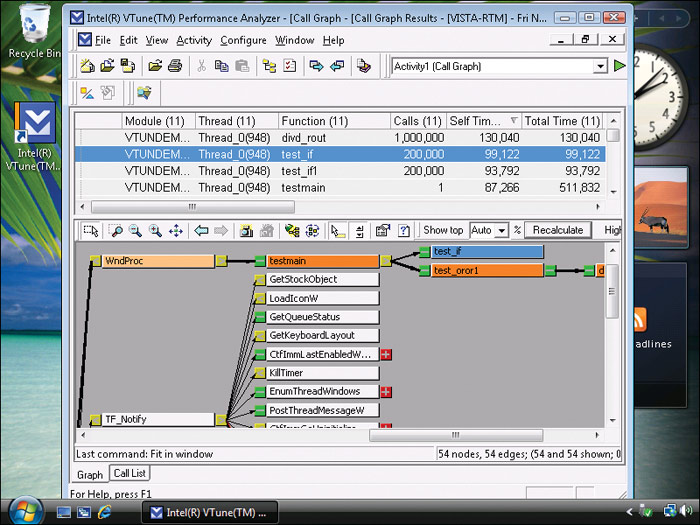
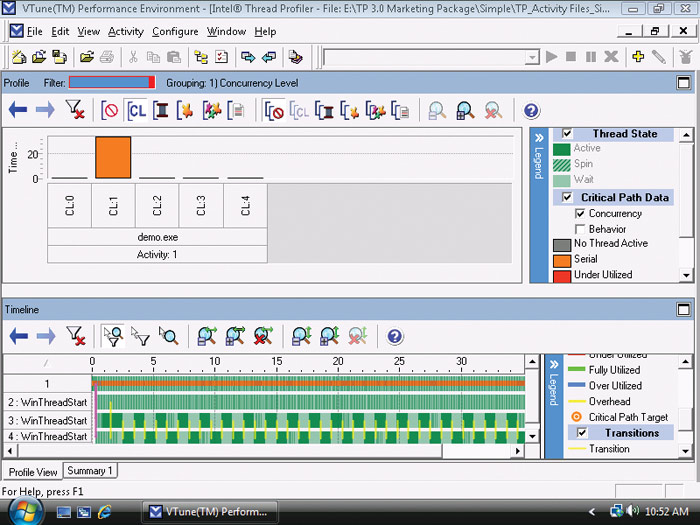
Highlights thread overhead and synchronization impact with Intel® Thread Profiler.
Multi-threading support for load balancing and idle time identification.
Works with all compiled languages & compilers † (C, C++, Fortran …)
Optimize Java* and Microsoft .NET applications including C# and Visual Basic.
Tune remote Linux* systems from Your Windows* Desktop.
back to top 
 

Features
Speed up your applications by using Intel® VTune™ Performance Analyzer throughout the development process to produce faster, more efficient code.
Performance: Advanced Optimization Features
Low Overhead Sampling Profiling
Event-based sampling finds your bottleneck with very low overhead (typically less than 5 percent). Identify problems such as cache misses, branch mis-predictions, and bus bandwidth. Because it is system-wide, event-based sampling can be used to tune libraries and drivers as well as application programs. No special builds or instrumentation are required.


Click to enlarge

Time- and Event-based sampling capability

See the Answers on Your Source
Source and disassembly views show you exactly which lines of code are taking the most time.


Click to enlarge

Performance data displayed on the source and assembly code

Find the Critical Path Using Call Graph Profiling
Call Graph determines calling sequences and graphically displays the critical path. It also shows you the context of the bottleneck. To be effective, you often need to know not only where the application is spending its time, but how it got there. See which functions took the most time to process or were blocked the longest.


Click to enlarge

Call Graph Profiling – Critical path shown in red. Selecting in the table (light blue row) selects in the graph (light blue box) and scrolls the view to make the function visible.

Identify System Issues with Counter Monitor
Quickly identify system level performance issues using the Counter Monitor to track system activity and resource consumption during runtime. For instance, it indicates whether reduced available memory or performance issues associated with file I/O slow down the application.


Click to enlarge

Counter Monitor - Allows real-time performance viewing

Tap Into an Expert Knowledge Base with Intel® Tuning Assistant
Increase productivity using Intel® Tuning Assistant to automatically provide advice based on an extensive knowledge base.


Click to enlarge

Intel Tuning Assistant – Provides tuning advice
back to top 
 

New In This Release

Analyze your code's performance on a variety of Intel® architectures throughout the development process with the latest Intel® VTune™ Performance Analyzer 9.0 for Windows*:

Profile JavaScript* and Flash* Code

New profiling support in emerging internet browsers and other script-oriented products allow developers working with new JavaScript* or Flash* JIT technologies to analyze their code.  Use the VTune analyzer to optimize for scalable performance of these codes on Windows* and Linux* to ensure the best end user experience with your application. VTune analyzer supports profiling JIT'd code when browser vendors add the required support. This enables deep performance analysis of these additional languages:

•  JavaScript / AJAX

•  Flash (Action Script)

Check with your browser supplier for details on when their browser will enable support.

Profile Dynamically Generated Code

Many applications today emit their own runtime-generated or just-in-time (JIT) code. New profiling APIs in the VTune analyzer enable performance analysis of dynamic code and allow you to view annotated source code directly from the analysis results.


Access to VTune Analyzer's Open Data Model

VTune analyzer can now support many different software platforms with performance sampling analysis.  Use the new open data model APIs to combine the VTune analyzer's powerful GUI on Windows* or Linux* with data from your custom collector to analyze any application on a wide range of platforms.

•  Collect data on operating systems not directly supported by the VTune analyzer.

•  Supported Windows* Operating Systems

•  Supported Linux* Distributions

•  Collect data on embedded Intel hardware based platforms.

Access to the latest Experimental Technologies

VTune analyzer users have access to the latest experimental performance tuning technologies Intel has to offer. Visit whatif.intel.com and look for Intel® Performance Tuning Utility and Intel® Platform Modeling with Machine Learning . These tools include a number of exciting capabilities including:

•  Statistical Call Tree - profiles with low overhead to detect where time is spent in your application

•  Basic Block Analysis - displays hotspots with basic block granularity and generates a control flow graph for advanced analysis of application, even without the source code

•  Data Access Profiling - identifies memory hotspots and relates them to code hotspots Dependency Plots - visualize the relationships between metrics

•  Event Rank - view the list of best predictors of performance using machine learning

New More Effective Tuning Methodology Supported

Pipeline stall accounting radically improves tuning by focusing the user on the instances of possible issues (like cache misses) which actually end up mattering. Core™2 Duo and Core™2 Quad processors have greatly enhanced performance analysis capabilities. These processors support more events, higher precision in event location correlation, and a new and wonderful pipeline stall accounting.

New Events For Tuning Multi-core Processors

These events measure parallelism, core sharing of the bus and cache and modified data sharing by threads. They identify opportunities to improve threading, tune multi-core sharing of the bus and cache and optimize cache-line usage.

Microsoft Windows Vista*
Click to enlarge

Visual Studio 2005 2008 Integration
Click to enlarge

Note: Features listed as "New" are new since the last major release 8.0. Some have been previewed in minor updates and beta releases.

back to top 
 

Compatibility
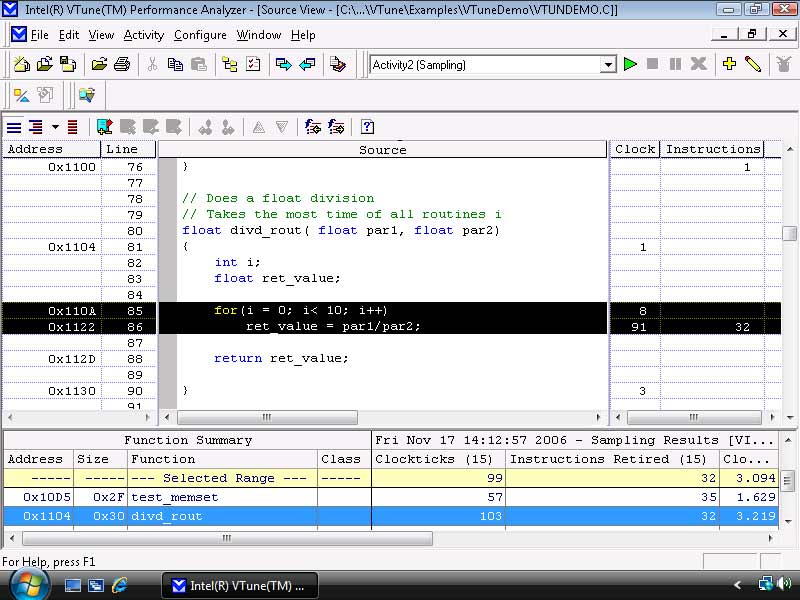
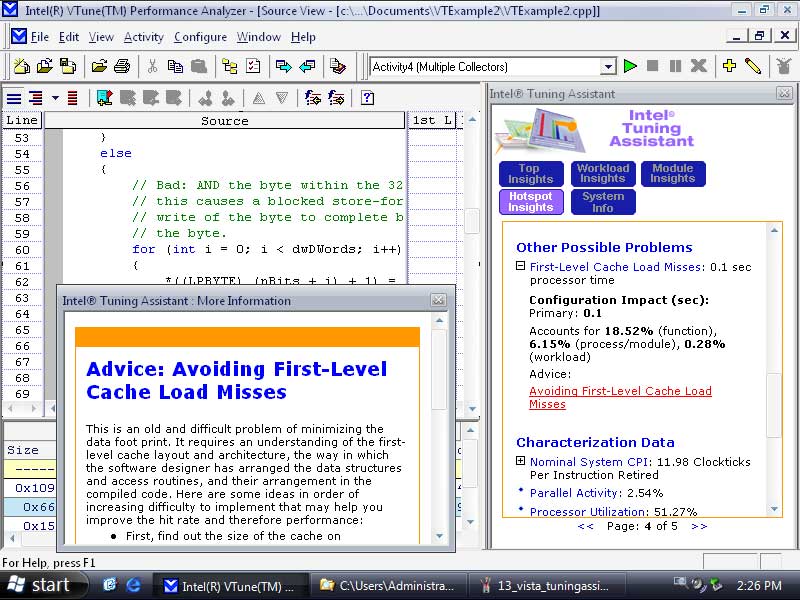
View the disassembled machine instructions annotated with detailed information on instruction latencies and stalls, as well as suggestions for possible changes to improve software performance.
Programming Language and Compiler Independent
VTune analyzer supports all compilers that follow industry standards including Microsoft and Intel compilers for C, C++ and Fortran . It also supports the most commonly used managed runtime environments like Microsoft .NET (including C# and Visual Basic), and Java* (details).
Processor Support
Supports the latest Intel processors, including Intel® Quad-Core processors.
Windows* Command Line Capability
Save time by automating sampling with the ability to collect sampling data through the command line, independent of the Intel VTune Performance Analyzer GUI.
Tune Remote Linux Systems from Your Windows* Desktop
Collect performance data on a remote target Linux system and analyze the results on your controlling Windows system. Or, try the native Linux* version of VTune™ Analyzer.
back to top 
 

System Requirements
Intel VTune Performance Analyzer 8.0 supports two usage models:
Single system - Perform analysis on software running locally on this system.
Two systems: host and target - Use the controlling host system to remotely analyze software running on the target system.
 
Host System
Target System

Requirements for Single System or Controlling Host System
The hardware and software requirements below apply to a single system used for native analysis, or a host system when using a second system for remote analysis. In both cases, the system referenced is the system upon which Intel VTune Performance Analyzer should be initially installed.

Single or Host System Hardware Requirements
Processors Supported
Intel® Celeron® processor
Intel Celeron D processor
Intel Pentium 4 processor
Intel Pentium 4 processor Extreme Edition
Intel Pentium D processor
Intel Pentium processor Extreme Edition
Intel® Xeon® processor
Intel Xeon processor MP
Intel® Itanium® 2 processor
Low Voltage Intel Itanium 2 processor
Dual-Core Intel® Itanium® 2 processor 9000 sequence (code named Montecito)
Intel Celeron M processor
Mobile Intel Celeron processor
Mobile Intel Pentium 4 Processor - M
Intel Pentium M processor
Intel® Core™ Solo processor
Intel® Core™ Duo processor
Intel XScale® technology-based processors, including the Intel® PXA25x, PXA26x, and PXA27x processors (remote data collection only)
System Memory Requirements on Single System
At least 128 MB of RAM
Disk Space Requirement
Minimum of 117 MB of disk space allocated as follows:
At least 97 MB of available space on a local drive
20 MB of disk space is required for system files on the drive containing the system directory (for example, the C drive)
Note: This additional hard disk space is needed for updating and installing the DLLs and OCXs that Intel® VTune™ Performance Analyzer requires to be in the system directory. Even if you install Intel VTune Performance Analyzer on a hard disk other than the drive containing the system directory, make sure that you have at least 20 MB free on the drive containing the system directory.
back to top 
 

Single or Host System Software Requirements
Operating Systems (OS)
Note: In all cases below, use the Windows* recommended virtual memory paging file size to prevent unexpected failures of Intel® VTune™ Performance Analyzer.
32-bit Windows operating systems supporting IA-32 processors:
Microsoft Windows XP Professional Edition
Microsoft Windows Server 2003 family
Microsoft Windows Vista* Beta 1 (build 5112)
Microsoft Longhorn Server* Beta 1 (build 5112)

64-bit Windows operating systems supporting Intel® processors with Intel® 64 architecture:
Microsoft Windows Server 2003 family with latest Service Pack available installed
Microsoft Windows Vista Beta 1 (build 5112)
Microsoft Longhorn Server Beta 1 (build 5112)

64-bit Windows operating systems supporting Intel® Itanium® 2 processors:
Microsoft Windows XP 64-bit Edition Version 2003 with the latest Service Pack available installed
Microsoft Windows Server 2003 family with latest Service Pack available installed
Microsoft Windows Vista Beta 1 (build 5112)
Microsoft Longhorn Server Beta 1 (build 5112)
Command-Line Support
An extensive subset of Intel VTune Performance Analyzer capabilities is available from the command line. The OS software requirements for the command-line interface are similar to the native usage model.
Additional Software Requirements
Microsoft Internet Explorer* version 5.0 or later (version 6.0 or newer recommended) is required for Intel VTune Performance Analyzer. Internet Explorer is available from Microsoft's Web site at http://www.microsoft.com/windows/ie/default.htm*
back to top 
 

Requirements for Target System
A system that meets the same processor and operating system requirements as the single or controlling host system detailed above can be used as the target in a remote analysis configuration. In addition, several versions of the Linux operating system are supported for remote analysis.
See Intel VTune Performance Analyzer Release Notes for information on:
Which versions of the Linux operating system are supported
Additional software requirements, including specific requirements for using Remote Call Graph and Remote Sampling
IA-32 or Itanium®-based systems
Systems based on Intel® 64 architecture
Applications running on Intel® PXA25x, PXA26x, and PXA27x processor-based systems using Intel XScale® technology can also be tuned using remote analysis capability. See the Intel VTune Performance Analyzer Release Notes for information on the target system requirements in this configuration.
back to top 
 

Support

Intel® Premier Support -- Every purchase of an Intel® Software Development Product includes a year of support services, which provides access to Intel® Premier Support and all product updates during that time. Intel Premier Support gives you online access to technical notes, application notes, and documentation. For support issues specific to VTune analyzer click on the support resources tab at the top of the page.

back to top 
 

Intel provides both the tools and support to enhance the performance, functionality and efficiency of software applications.
Compatible with leading Windows* and Linux* development environments, Intel® Software Development Products are the fastest and easiest way to take advantage of the latest features of Intel processors. Intel Software Development Products are designed for use in the full development cycle, and include Intel® Performance Libraries, Intel® Compilers (C++, Fortran for Windows, Linux, and Mac OS*), Intel® VTune™ Analyzer, Intel® Threading Tools and Intel® Cluster Tools.
The Intel® Premier Customer Support Web site provides expert technical support for all Intel software products, product updates and related downloads. For additional product information visit: www.intel.com/software/products.
Intel, the Intel logo, Itanium, Pentium, Intel Centrino, Intel Xeon, Intel XScale, VTune, Celeron, Intel NetBurst, and MMX are trademarks or registered trademarks of Intel Corporation or its subsidiaries in the United States and other countries.
† VTune analyzer is programming language and compiler independent. It supports all compilers that follow industry standards including Microsoft and Intel compilers for C, C++ and Fortran. It also supports the most commonly used managed runtime environments like Microsoft .NET (including C# and Visual Basic), and Java*.
*Other brands and names may be claimed as the property of others. Visit our Legal Information Web site for more information.
Copyright © 2006, Intel Corporation
back to top