Product Information
| Intel® Software Development Products for Intel® Platforms and Technologies | |
| Intel® VTune™ Performance Analyzer 9.1 For Linux* Product Information |
|
 |
|||||||||||||||
|
|||||||||||||||
|
||||||||||||||||||||||||||
|
||||||||||||||||||||||||||
| ||||||||||||||||||||||||||
| back to top
|
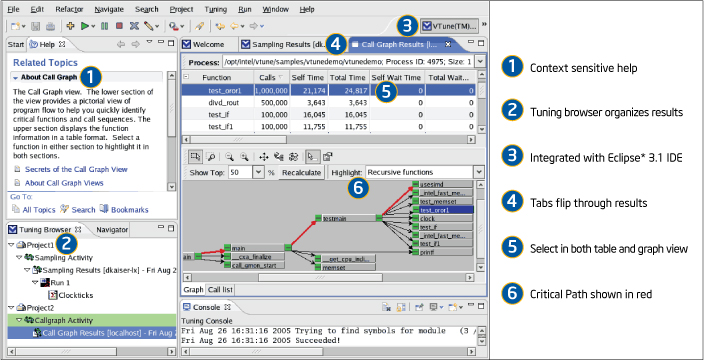
Find the Critical Path Using Call Graph Profiling Call Graph determines calling sequences and graphically displays the critical path. It also shows you the context of the bottleneck. To be effective, you often need to know not only where the application is spending its time, but how it got there. | |||||
| |||||
Unlike other offerings, VTune analyzer provides both sampling and call graph analysis. Even if you plan to do mostly call graph analysis, running sampling first lets you identify the modules that need it so you only pay Call Graph's larger overhead for the modules that need to be analyzed. This can be vital on large projects. Sampling is great for analysis of "loopy" code. Call Graph is usually better for "branchy" code. You need both to get the job done right. | |||||
| |||||
| back to top
|
|
All Architectures: |
|
|
|
| back to top
|
Large Enterprise and HPC Systems: |
|||||||
|
|||||||
Intel® Itanium® Architecture: |
||
|
||
| back to top
|
|
Profile JavaScript* and Flash* Code New profiling support in emerging internet browsers and other script-oriented products allow developers working with new JavaScript* or Flash* JIT technologies to analyze their code. Use the VTune analyzer to optimize for scalable performance of these codes on Windows* and Linux* to ensure the best end user experience with your application. VTune analyzer supports profiling JIT'd code when browser vendors add the required support. This enables deep performance analysis of these additional languages: • JavaScript / AJAX • Flash (Action Script) Check with your browser supplier for details on when their browser will enable support.
Profile Dynamically Generated Code Many applications today emit their own runtime-generated or just-in-time (JIT) code. New profiling APIs in the VTune analyzer enable performance analysis of dynamic code and allow you to view annotated source code directly from the analysis results.
Access to VTune Analyzer's Open Data Model VTune analyzer can now support many different software platforms with performance sampling analysis. Use the new open data model APIs to combine the VTune analyzer's powerful GUI on Windows* or Linux* with data from your custom collector to analyze any application on a wide range of platforms. • Collect data on operating systems not directly supported by the VTune analyzer. • Supported Windows* Operating Systems • Supported Linux* Distributions • Collect data on embedded Intel hardware based platforms.
Access to the latest Experimental Technologies VTune analyzer users have access to the latest experimental performance tuning technologies Intel has to offer. Visit whatif.intel.com and look for Intel® Performance Tuning Utility and Intel® Platform Modeling with Machine Learning . These tools include a number of exciting capabilities including: • Statistical Call Tree - profiles with low overhead to detect where time is spent in your application • Basic Block Analysis - displays hotspots with basic block granularity and generates a control flow graph for advanced analysis of application, even without the source code • Data Access Profiling - identifies memory hotspots and relates them to code hotspots Dependency Plots - visualize the relationships between metrics • Event Rank - view the list of best predictors of performance using machine learning |
|||||
New More Effective Tuning Methodology Supported New Events for Tuning Multi-Core Intel®
Processors New Linux Distributions! Faster Call Graph - Selective Instrumentation for Java* and Native Code Supports the Latest Intel®
Processors |
|||||
| back to top
|
Powerful User Interface Improvements Tune Inline Functions
|
||||||||||
| Large Enterprise and HPC Systems Minimize Bus Traffic in Non-uniform Memory Architecture (NuMA) Systems
|
||||||||||
New for Itanium® Architecture! |
||||||||||
|
||||||||||
|
Note: Features listed as "New" are new since the last major release 8.0. Some have been previewed in minor updates and beta releases. **GCC uses the older Dwarf2 format. In some cases there is not enough information to associate the inlined instance with the correct caller source line. In this case VTune analyzer will guess and associate the contribution of the inlined instance with the nearest caller source line. This may create an event mismatch between Source and Function Views. The newer Dwarf3 format used by ICC 8.1 and higher eliminates this problem by unambiguously associating inlined instances with the caller source line. GCC 4.0.2 may partially support Dwarf3, but it not complete enough to help with this problem. |
||||||||||
| back to top
|
|
Powerful User Interface Improvements VTune Performance Analyzer for Linux offers you a view into the Linux application, exposing bottlenecks and hotspots in the code, allowing you to easily pinpoint areas in the code that can be improved. Your Linux application can gain outstanding performance, providing a competitive advantage. Improve application performance on Intel architectures with these optimization features: |
||||
| Event-Based, System-Wide Sampling | ||||
| Call Graph Profiling | ||||
| Rich, easy-to-use Graphical User Interface | ||||
| Hotspot Analysis | ||||
| Memory-Intensive Application Support | ||||
| Static Analysis and Disassembly | ||||
| VTune Performance Analyzer Driver Kit | ||||
| back to top
|
|
Supports Intel® Architecture-Compatible Processors Use VTune Performance Analyzer for Linux to speed applications for a variety of supported environments: |
||||
| Fully |
||||
| Support for the latest Intel® processors, including those with Intel® 64 architecture | ||||
| Multiple programming languages | ||||
| Java application profiling | ||||
| Command-line capability | ||||
| Support for Linux 2.6 kernels and MontaVista Linux* Carrier Grade Edition | ||||
| back to top
|
|
|
| Usage Models |
Intel® VTune™ Performance Analyzer for Linux supports two usage models: |
|
| Single System: Analyze the performance of software running locally on the same system as VTune analyzer. | |
| Two Systems (Host and Remote Target): A host computer running VTune analyzer can control event-based sampling and call graph data analysis on a remote target machine running a remote data collector (RDC). The connection between the target and host computers is TCP/IP. This is useful for analysis of embedded systems or to lower the measurement overhead on the target system by using fewer resources. | |
| back to top
|
|||
| Supported Processors | |||||||||||||||||||||||||||||||||||||||||||||||||||||||||||||||||
| Processor Requirements for Host (Eclipse* or command line interface) | |||||||||||||||||||||||||||||||||||||||||||||||||||||||||||||||||
|
|||||||||||||||||||||||||||||||||||||||||||||||||||||||||||||||||
| Processors Supported by Data Collector (Target) | |||||||||||||||||||||||||||||||||||||||||||||||||||||||||||||||||
|
|||||||||||||||||||||||||||||||||||||||||||||||||||||||||||||||||
| back to top
|
|||
| Supported Linux Distributions (Host and Target) | |
Please check the release notes for details on the exact OS update and kernel version supported by the latest software. The information on this page is for software version 9.0. There may be software updates supporting newer distributions please check for updates. |
|
Operating System |
IA-32 |
Intel® 64 Architecture |
Itanium® Architecture |
||||
Red Flag Linux 5.0 (DataCenter) |
|
|
|
||||
Red Hat Enterprise Linux* 3.0 |
|
|
|
||||
Red Hat Enterprise Linux 4.0 |
|
|
|
||||
Red Hat Fedora* Core 5 |
|
|
|
||||
SGI Pro Pack* 4.0 |
|
|
|
||||
SGI Pro Pack 5.0 |
|
|
|
||||
SuSE Linux 10 |
|
|
|
||||
SuSE Linux Enterprise Server*
(SLES) 9.0
|
|
|
|
||||
Red Flag Linux 5.0 (DataCenter) |
|
|
|
||||
SuSE Linux Enterprise Server (SLES) 10.0 |
|
|
|
||||
Notes: |
|||||||
| back to top
|
|||
| Software Requirements | ||
Host Software Requirements for Graphical User Interface Integrated with Eclipse* |
||
| Type | Requirements | |
| Eclipse*† Development Environment |
|
|
| Supported Java* Development Kit (JDK) |
|
|
VTune™ Analyzer Has Been Tested for Profiling Under the Following JDKs* |
||
| System Type | Profiling Supported JDKs* | |
| IA-32 architecture |
|
|
| Intel® 64 architecture |
|
|
| Itanium® architecture |
|
|
Java Tuning Support Note: All of the information above is for version 9.0 of VTune Performance Analyzer for Linux and is subject to change. While we make every effort to make sure this information is correct, the most current and accurate details are found in the release notes that ship with the product. Be sure you have the latest software - check for updates. |
|
| back to top
|
|
Every purchase of an Intel® Software Development Product includes a year of support services, which provides access to Intel® Premier Support and all product releases during that time. You receive online access to our expert engineering support staff and additional technical documentation. |
| back to top
|
1 Large applications are welcome! For example, the source distribution tree of one large application including the tools and predefined libraries required to do a build (but not the build itself) is about 1.85 GB with over 62,700 files. The execution tree alone is about 870 MB with over 8200 files. |
2 Sampling only. |
3 Large applications are welcome! For example, the source distribution tree of one large application including the tools and predefined libraries required to do a build (but not the build itself) is about 1.85 GB with over 62,700 files. The execution tree alone is about 870 MB with over 8,200 files. |
4Due to the unique requirements for supporting large systems, if the software will be used on systems with more than 128 cores please contact us before purchase to make special arrangements. |
‡ Technical support for Eclipse is not provided by Intel. For more information on Eclipse, please visit the Eclipse Foundation* Web site. |
§ Wireless connectivity requires additional software, services or external hardware that may need to be purchased separately. Availability of public wireless access points is limited. System performance, battery life and functionality will vary depending on your specific hardware and software. |
| Intel provides both the tools and support to enhance the performance, functionality and efficiency of software applications. |
| Compatible with leading Windows* and Linux* development environments, Intel® Software Development Products are the fastest and easiest way to take advantage of the latest features of Intel processors. Intel Software Development Products are designed for use in the full development cycle, and include Intel® Performance Libraries, Intel® Compilers (C++, Fortran for Windows, Linux, and Mac OS*), Intel® VTune™ Analyzer, Intel® Threading Tools and Intel® Cluster Tools. | The Intel® Premier Customer Support Web site provides expert technical support for all Intel software products, product updates and related downloads. For additional product information visit: www.intel.com/software/products. | Intel, the Intel logo, Itanium, Pentium, Intel Centrino, Intel Xeon, Intel XScale, VTune, Celeron, Intel NetBurst, and MMX are trademarks or registered trademarks of Intel Corporation or its subsidiaries in the United States and other countries. | *Other brands and names may be claimed as the property of others. Visit our Legal Information Web site for more information. | Copyright © 2006, Intel Corporation |
| back to top
|