| Completeness |
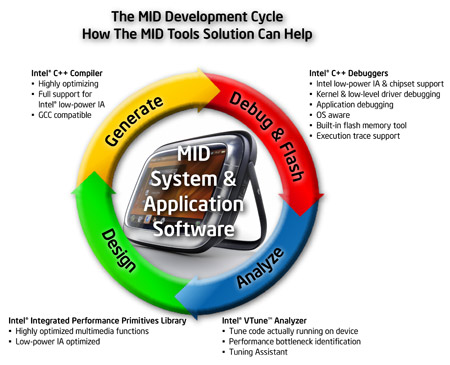
| Use a set of software tools based on latest tools technology for the entire software product development cycle (Design, Generate, Debug, and Analyze) without the need to research the components of other tools.
|
| Performance |
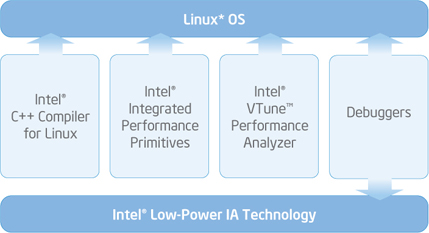
| New in-order scheduler and improvements in the compiler provide a significant performance advantage over GCC. Highly optimized Intel® Integrated Performance Primitives provide the same simple API as for IA-32, while highly optimized for Intel’s new low-power IA. Intel® VTune™ Performance Analyzer helps to identify performance bottlenecks.
|
| In-order scheduler Compiler feature |
| By minimizing dependency stalls due to low power IA optimized instruction scheduling, the execution of routines can be sped up significantly.
|
| The new low-power IA does not provide an integrated out-of-order scheduler that schedules instruction dispatch into the execution pipeline to take optimum advantage of the architecture and minimize dependency stalls. The Intel® C++ Compiler models the low-power IA pipeline and execution flow, thus enabling it to produce code with the optimum instruction execution sequence for low-power IA.
|
Multimedia and Performance Libraries |
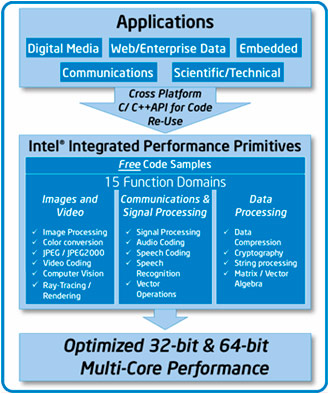
With Intel® Integrated Performance Primitives (Intel® IPP) application developers can concentrate on feature implementation rather than optimization of application code. Intel® IPP provides performance-optimized building-block functions for key MID software applications such as: multimedia playback/recording, editing, image processing, audio/speech/signal processing and network data communications. Free code samples downloadable from the Intel website enhance the value of the Intel IPP functions by illustrating the implementation of multithreaded application blocks such as video, audio and speech codecs.
Learn more about Intel® IPP.
|
Efficiency and Productivity |
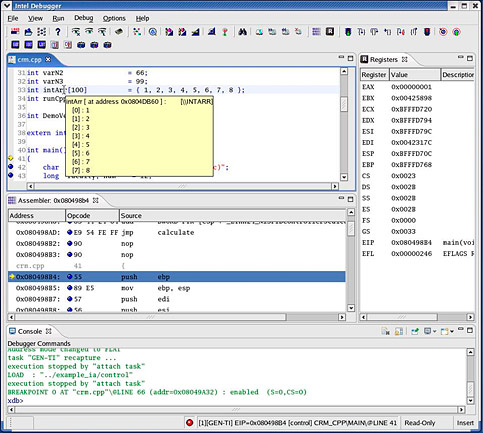
| Intel® Debuggers for Mobile Internet Devices support all aspects of debugging, from low-level driver and kernel debugging to high-level language C++ application debugging, with full execution trace support, and flash memory writer capabilities (only with JTAG hardware interface). Applications can be debugged natively on the host development environment as well as remotely via TCP/IP.
Click to enlarge
|
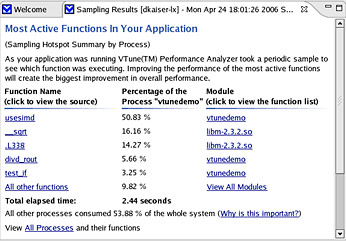
Intel® VTune™ Performance Analyzer makes it fast and easy to find performance bottlenecks with a list of the most active functions. Click on a function name to display the source and show the most time-consuming source statements. Furthermore, Event Based Sampling support for low-power IA enables you to determine causes for execution stalls that impact performance.
Learn more about Intel® VTune™ Performance Analyzer.
Click to enlarge
|
| Source and assembly views show you exactly which lines of code are taking the most time.
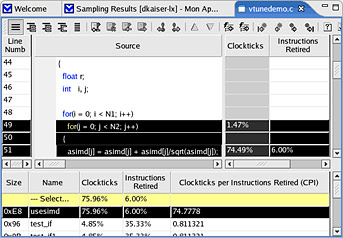
Click to enlarge
|
  |
Full Eclipse RCP based GUI helps to have better visibility of the application and system properties and thus have better control over the debugging process. Latest GUI technology enables developers to be more productive.
|
| |
Full Intel LPIA Silicon support provides an in-depth view into Intel® Low-power IA technology. Provides easy access to most Si specific features, including architectural registers, Intel® SSE3, etc. |
| |
Execution Trace Support enhances the understanding of the flow of an executed program. It thus helps significantly with the isolation of memory leaks, data structure alignment and execution flow issues. Displaying execution trace for system and application debugging enables more effective debug cycles. |
| |
Linux OS Awareness for full understanding of the system behavior at all times. Display all relevant kernel information, and debug the application in context with the OS. |
| |
JTAG Debugger included in the MID Tool Suite. The JTAG Debugger supports direct hardware access through an Intel JTAG debugger interface which enables developers to access Si specific features without having any software running on the target processor. The JTAG Debugger is recommended for Operating System Vendors (OSVs) and Device Manufacturers (OEMs). Note: For the use of the JTAG debugger, an Intel specific JTAG hardware interface is required which can be obtained through Intel only. OEMs and OSVs should contact their Intel representative. |
| Component |
Minimum |
Recommended |
| Processor |
A system based on an IA-32 architecture-based processor (minimum 1GHz Intel Pentium® 4 processor or greater), Intel 64 architecture-based processor, or a system based on an AMD Athlon* or AMD Opteron processor |
|
 |
Intel® Core™ family processor |
|
Intel® Pentium® 4 processor |
|
SSE3 support for native functionality testing before target deployment |
|
| RAM |
|
|
| Disk Space |
| 700 MB of disk space, plus an additional 200 MB during installation for the download and temporary files |
|
|
| Operating System |
One of the following Linux distributions (this is the list of distributions tested by Intel; other distributions may or may not work and are not recommended - please contact Intel® Premier Support if you have questions): |
|
|
| Other Software |
Linux Developer tools component installed, including gcc 3.2.3, 3.3, 3.4, 4.1, or 4.11, g++ and related tools.
Linux component compat-libstdc++ providing libstdc++.so.5
For debugger additionally: |
|
|
| Component |
Minimum |
Recommended |
| Processor |
| Intel® Atom™ Processor Z5xx |
|
|
| RAM |
|
|
| Hard Disk |
| 2GB Hard Disk or Solid State Disk (USB Stick, Flash memory based Disk on Chip) |
|
|
| Operating System |
One of the following Linux distributions (this is the list of distributions tested by Intel; other distributions may or may not work and are not recommended - please contact Intel® Premier Support if you have questions): |
|
Moblin* |
|
Red Flag MIDINUX 2.0 |
|
Ubuntu* Ultra Mobile Edition 1.x |
|
|
| Other Software |
VTune™ Performance Analyzer requires Linux Developer tools component installed, including gcc 3.2.3, 3.3, 3.4, 4.1, or 4.11, g++ and related tools to be installed for collector rebuild.
|
|
|


;)
;)
;)