| Analyze MPI performance, Speed up parallel application runs, locate hotspots and bottlenecks, Compare trace files with graphics providing extensively detailed analysis and aligned timelines. |
Why Intel TAC 7.1?
 |
Supported on Linux* and Microsoft* Windows* Compute Cluster Server 2003 |
|
Intuitive full color customizable GUI with many drill down view options |
|
Highly Scalable with low overhead and efficient memory usage |
|
Easy run-time loading - or instrument an MPI application executable |
|
MPI Correctness Checking Library detects many types of errors in communication |
|
Integrated online help |
|
Easy installation and full documentation |
|
Full tracing and/or light-weight statistics gathering |
|
Many features, many options, major performance improvements
|
PIN-based binary instrumentation |
|
Runtime behavior displayed by function, process, thread, timelines or cluster or node |
|
Multiple types of filtering (functions, processes, messages) and aggregation |
|
Performance counter data recording can be displayed as timeline |
|
Trace data is cached to reduce runtime overhead and memory consumption |
|
Traces multi-threaded MPI applications for event-based tracing to non-MPI applications |
|
Fail safe tracing |
|
Support for MPI-1, SHMEM, MPI-IO, ROMIO |
|
Distributed memory checking with the MPI Correctness checking library (Linux) |
|
Trace Collector
|
Automated MPI tracing and MPI Correctness Checking |
|
Generic distributed (non-MPI) and single process tracing |
|
Thread level tracing with traces created even if application crashes |
|
HPM data collection (PAPI, rusage, OS-counters) |
|
Configurable tracefile parameters |
|
Feature disabling/enabling |
|
Tuning parameters |
|
Distributed Memory checking with Valgrind |
|
Binary runtime instrumentation |
|
Compiler instrumentation
| |
1. Icc/ifort/icpc -tcollect |
| |
2. Gcc/g++ -finstrument-functions |
|
|
API: source code instrumentation (counter, function, message and collective operation logging) |
|
Trace Analyzer
|
Event, Quantitative, Qualitative, and Counter Timelines |
|
Flexible message and collective operation Profiles |
|
Function Profile (call graph, call tree, flat and load balance) |
|
Detailed comparison (of 2 traces) |
|
Multi-level source code visualization with a full text browser |
|
Flexible and powerful event tagging and filtering |
|
Hierarchical grouping and aggregation across function or processes data |
|
Large set of configuration parameters per chart |
|
Export profiling data as text; export charts to graphics or printer |
|
Command line interface |
|
| MPI Checking
Included in Intel Trace Analyze and Collector is a unique MPI correctness checker to detect deadlocks, data corruption, or errors with MPI parameters, data types, buffers, communicators, point-to-point messages and collective operations. By providing checks at run-time, and reporting the errors as they are detected, the debugging process is greatly expedited. The correctness checker also allows debugger breakpoints to help in-place analysis but has a small enough footprint to allow use during production runs.
The true benefit of the Trace Analyzer and Collector Correctness Checker is the potential to scale to extremely large systems and the ability to detect errors even among a large number of processes. The checker can be set to work based on profiles (specific implementations) and view deadlocks regardless of fabric type.
By tracking data types and wrapping MPI calls, the requests and communicators can be reused from the trace collector. (The checking library is compiled from the source code of the performance data collection library.) The Analyzer is able to extremely rapidly unwind the call stack and use debug information to map instruction addresses to source code with and without frame pointer.
With both command line and GUI interfaces the user can additionally set up batch runs or do interactive debugging. The timeline view shows actual function calls and process interactions which highlights excessive delays or errors that stem from improper execution ordering.
Instrumentation and Tracing
Intel Trace Analyze and Collector specialize in low intrusion binary instrumentation (for IA-32 and Intel® 64 architecture). It can create and add this instrumentation to existing statically and dynamically linked binary executables to allow automatic monitoring of MPI as well as function entry and exit points. This includes the capability of tracing and recording performance data from parallel threads in C, C++ and Fortran.
The Intel Trace Analyzer and Collector support both MPI applications and distributed non-MPI applications in C, C++, and Fortran. For applications running with Intel® MPI library this includes tracing of internal MPI states.
Interface and Displays |
Timeline Views and Parallelism Display
|
Displays concurrent behavior of parallel applications |
|
Displays application activities, event source code locations, and message-passing along time axis (see Figure 1) |
|
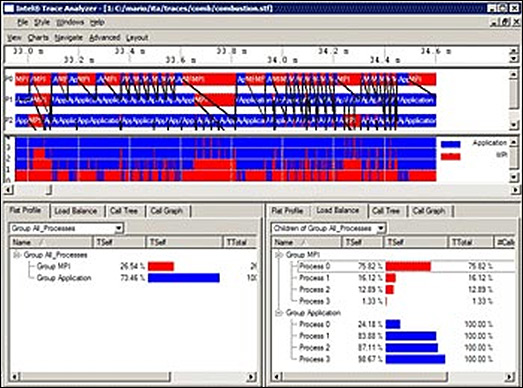
Figure 1. Timeline Views and Parallel Displays |
Advanced GUI
|
Manages displays and statistics with fast interface |
|
Uses object point-and-zoom for enhanced detail, context-sensitive sub-menus |
|
Couples displays to allow focused analysis |
|
Supplies automatic updates of recomputed statistics |
|
Provides timeline displays, call-graph, performance profile for function groups and communication in a specific phase of parallel execution |
|
Display Scalability
|
Navigates through trace data levels of abstraction: cluster, node, process, thread, and function hierachies (classes) |
|
Detailed and Aggregate Views
|
Examines aspects of application runtime behavior, grouped by functions or processes |
|
Easily identifies the amount of time spent e.g. in MPI communication |
|
Easily see the performance differences between two program runs (see Figure 2) |
|
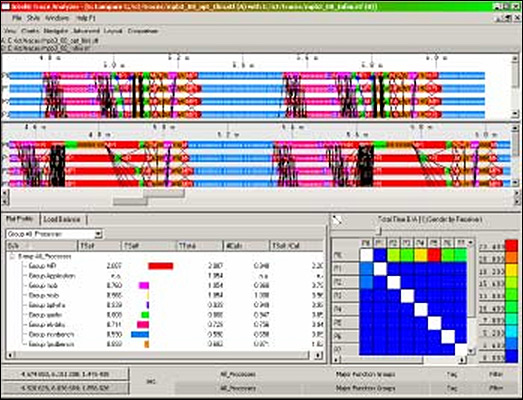
Figure 2. New comparison displays for comparing two trace files |
Ease of Use
|
Offers user-friendly application programming interface (API) to control or record user events |
|
Adds versatile recording and analysis of counter data (see Figure 3) |
|
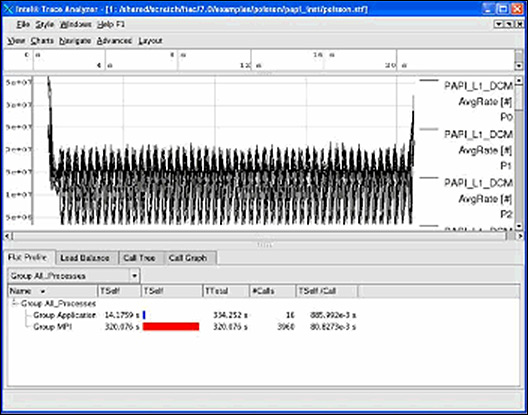
Figure 3. New Counter timeline display |
Metrics Tracking
Communication Statistics
|
Displays communication patterns of parallel applications |
|
Displays metrics for an arbitrary time interval |
|
Through comparison it keeps track of the performance increase of an algorithm change |
|
Figure 4 shows the same algorithm with synchronous communication (left) vs. asynchronous communication (right) with communication overhead (red) |
|
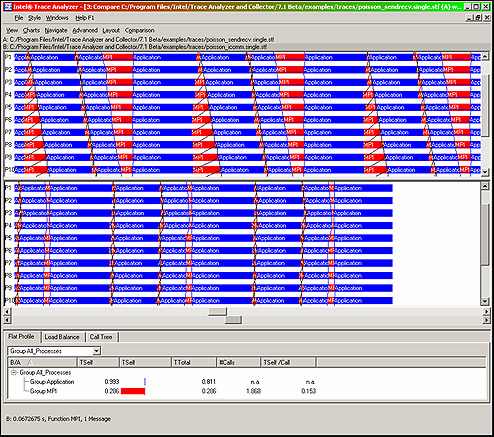
Figure 4. Synchronous and Asynchronous Communication |
Execution Statistics
|
Provides subroutine execution metrics down to the level of call-tree characteristics |
|
Though binary, compiler-driven and source code instrumentation it offers very detailed analysis beyond MPI |
|
Profiling Library
|
Records distributed, event-based trace data |
|
Statistics Readability
|
Examines aspects of application runtime behavior, grouped by functions or processes Logs information for function calls, sent messages, and collective operations |
|